Line Chart
A line chart UI type is used to display a line chart showing trends over time in AI chat. Under the hood, it uses Apache ECharts library to render the chart. In your AI Agent builder you should response in output key with this format:
output:
[
.... can be other ui types ...
{
"ui_type": "line-chart",
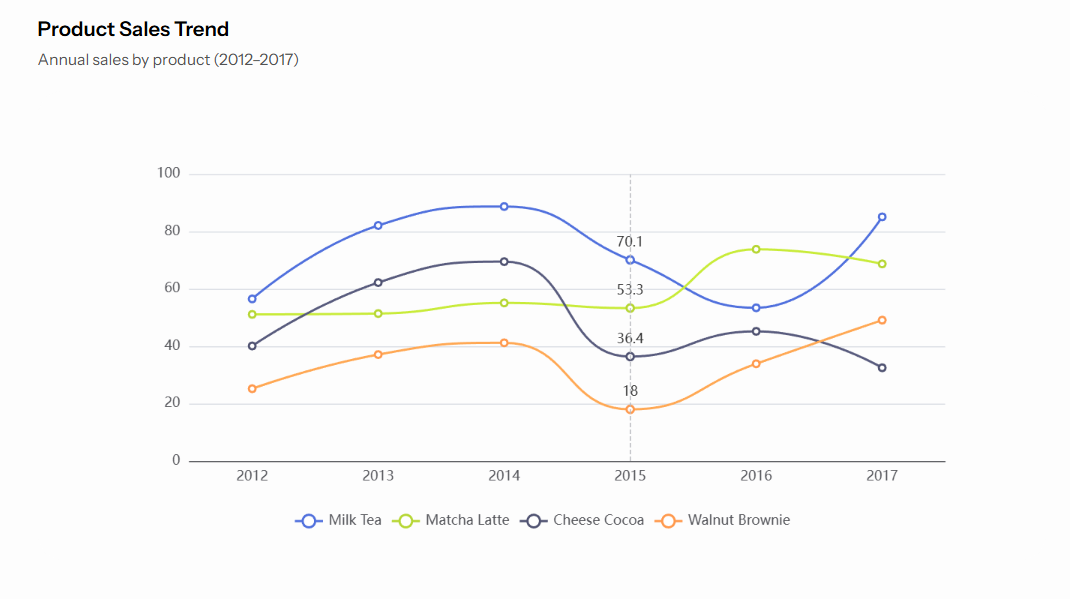
"title": "Product Sales Trend",
"description": "Annual sales by product (2012–2017)",
"data": {
"x_axis": {
"values": [
"2012",
"2013",
"2014",
"2015",
"2016",
"2017"
]
},
"series": [
{
"name": "Milk Tea",
"data": [
56.5,
82.1,
88.7,
70.1,
53.4,
85.1
]
},
{
"name": "Matcha Latte",
"data": [
51.1,
51.4,
55.1,
53.3,
73.8,
68.7
]
},
{
"name": "Cheese Cocoa",
"data": [
40.1,
62.2,
69.5,
36.4,
45.2,
32.5
]
},
{
"name": "Walnut Brownie",
"data": [
25.2,
37.1,
41.2,
18,
33.9,
49.1
]
}
]
}
},
... can be other ui types ...
]
tip
Title and description are optional. If you need to display only line chart data you can omit them.
X axis should be in data.x_axis.values field. Series should be in data.series field. Series should have name and data fields. Data should be an array of numbers. In general, the line chart should be populated with data returned from your AI Agent Service. In most cases, this is done using a loop (e.g. for or foreach) to iterate over the results and build the response in the format described above.
Result: