Pie Chart
A pie chart UI type is used to display a pie chart from data in AI chat. Under the hood, it uses Apache ECharts library to render the chart. In your AI Agent builder you should response in output key with this format:
output:
[
.... can be other ui types ...
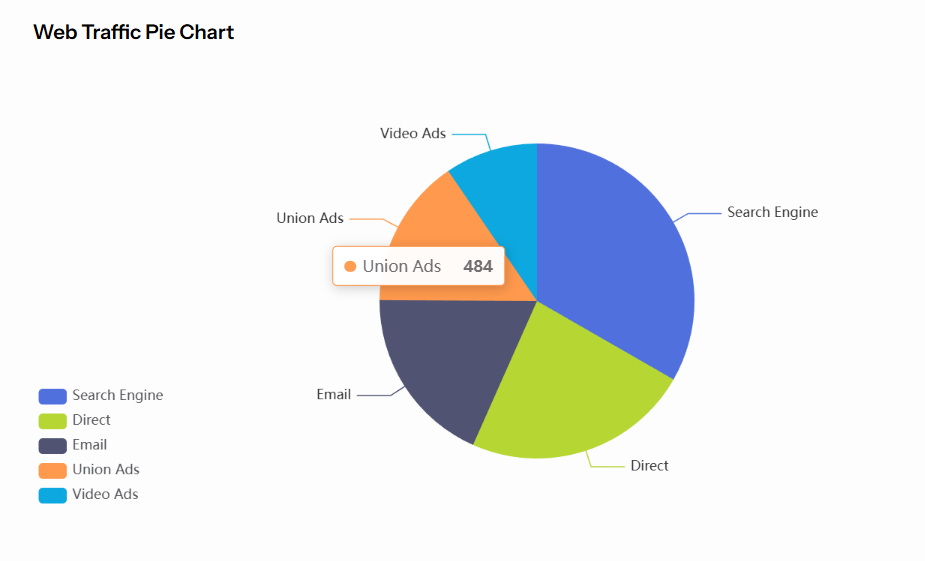
{
"ui_type": "pie_chart",
"title": "Web Traffic Pie Chart",
"data": {
"series":
[
{
"name": "Search Engine",
"value": 1048
},
{
"name": "Direct",
"value": 735
},
{
"name": "Email",
"value": 580
},
{
"name": "Union Ads",
"value": 484
},
{
"name": "Video Ads",
"value": 300
}
]
}
},
... can be other ui types ...
]
tip
Title and description are optional. If you need to display only pie chart data you can omit them.
Series should be in data.series field. Series should have name and value fields. In general, the pie chart should be populated with data returned from your AI Agent Service. In most cases, this is done using a loop (e.g. for or foreach) to iterate over the results and build the response in the format described above.
Result: